by Sean Trende
In 1880, Americans did something momentous: They all elected their congressional delegations in the same year. Prior to that, elections had been a hodgepodge affair. For example, the first elections for the 28th Congress, which ostensibly met from 1843 to 1845, were held in Missouri on Aug. 1, 1842. But only five other states held elections that year; almost all other states held them over the course of the odd numbered year of 1843. Maryland finally got around to holding its elections on Feb. 14, 1844, a half-year before the presidential election and less than a year before the next Congress convened.
Even after 1880, a truly uniform Election Day did not arrive until 1960, when Maine gave up its stubborn insistence on holding its congressional elections in September. But for all intents and purposes, 1882 marks the birth of the phenomenon we know today as the midterm election year.
It also birthed one of the rare observations in politics about which political scientists and “lay” observers of elections are in near-unanimous agreement: Midterm elections tend to go badly for the party that holds the White House. James Garfield barely won the presidency in the 1880 election – he carried the Electoral College by 60 votes and the popular vote by less than 2,000 votes. Two years later, Republicans lost 34 seats in the House (there were only 325 representatives at the time, so this is the equivalent of over 40 seats in today’s House).
The president’s party has lost seats in almost every ensuing presidential election. There have been four exceptions: 1902, 1934, 1998 and 2002. The 1902 midterm probably does not deserve to be counted in this category, however, as the size of the House had been enlarged after the decennial redistricting. On average, the party in power has lost around 30 seats in midterm elections, but this statistic includes years like 1894, when the Democrats lost 125 seats, nearly half their caucus. In the postwar era, elections have been quieter, with the president’s party losing around 25 seats.
In the Senate, it is a somewhat different story. Because the chamber’s seats are staggered, with only a third of them up in any given year, a party may go into a predictably rough election with very few vulnerable seats up for election. On average, the president’s party still loses seats – around four – but since direct election of senators began nationally in 1914, the president’s party has gained seats or broken even in eight elections – around one in three.
The most important predictor of a party’s performance in a midterm is the president’s job approval rating. So, for example, the years where the president’s party has gained ground in the House during a midterm election have been years where the president has been exceptionally popular. The 1998 midterms occurred against the backdrop of a massive economic boom and an unpopular impeachment attempt from Republicans, while the 2002 midterms occurred while George W. Bush was still enjoying his post-9/11 bounce. Both presidents enjoyed approval ratings in the mid-60s on Election Day.
While we don’t have polling data for FDR in 1934, one can imagine that his job approval was likely well into the 70s. One the other hand, abysmal elections for parties in power have occurred when the president was generally unpopular: Witness 1994, 2010, and 2018. Thus, the trend in President Biden’s job approval has to be concerning for Democrats:
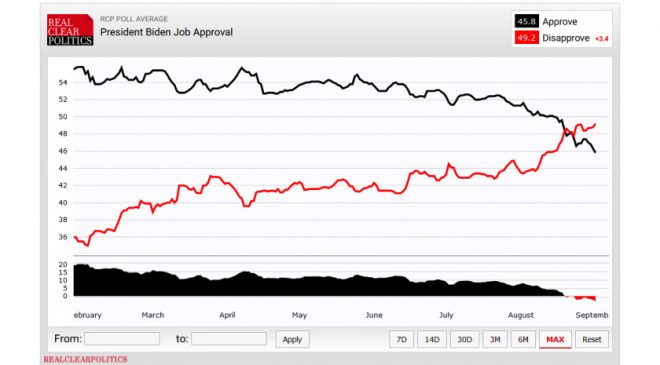
Let’s look at the implications of this, first through the lens of Senate elections, then through the lens of House elections. I’ve explored Senate elections in this article. As the chart near the bottom indicates, when Biden was hovering around 52% job approval, Democrats were heavily favored to maintain control of the Senate. The most likely outcome for the party was that it would actually gain a seat.
But Democrats’ chances of holding the Senate were slated to drop off quickly if the president’s job approval fell any further. At 50%, they would be expected to break even, but would lose control about one time out of four. At 49% job approval, the Senate is considered 50-50.
At 46%? Democrats would lose between four and zero seats 95% of the time, with an expected outcome of two seats. They only retain control about 4% of the time. This is obviously an outcome Democrats would like to avoid.
What about the House? Modeling aggregate House elections is a treacherous task, as there is just too much froth at the individual House level. Nevertheless, we can draw some broad generalizations from previous elections, using factors that I’ve referenced previously.
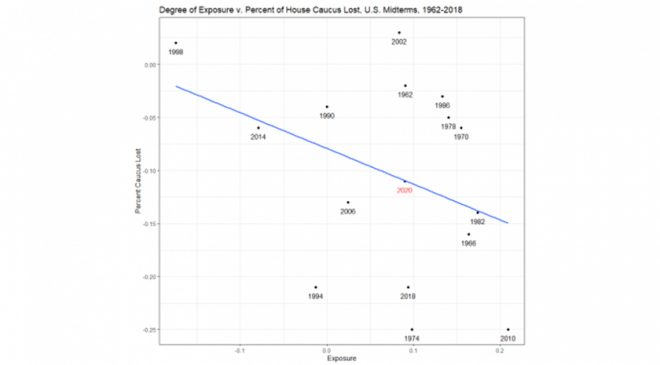
The first data-relevant piece of datum is the president’s party’s degree of exposure. That is to say: Midterm elections tend to be regressions to mean. When a president’s party performs well above the average from prior elections in the presidential election, the tendency is for their midterm losses to be more severe. This is because large House gains often require overextension into opposition party areas.
When Barack Obama won the presidency in 2008, more than 40 Democratic House candidates prevailed in districts that John McCain won, even as McCain was losing the national popular vote by seven percentage points. It isn’t surprising, then, that Democrats suffered a shellacking two years later. In the same vein, in 1998 Republicans were still defending a lot of marginal districts from their 1994 wave. Democrats went into that election with minimal exposure, which helped secure their wins.
Democrats begin this cycle with a relatively low degree of exposure, consistent with a loss of 18 seats or so. But if anything, this overstates their problem. Very few Democrats represent Trump districts, and only 20 or so represent districts that were more Republican than the country as a whole. At the same time, we don’t know what the effect of redistricting will be.
A Republican Party as overstretched as the Democrats are today suffered massive losses in 1974 and achieved modest gains in 2002. Another factor we look at is the growth of the economy. I have traditionally used real disposable income as a stand-in. As we can see, growth in personal income is correlated with parties performing better in midterms. Years with soft or negative income growth, like 1974, 1982, 1994 and 2010, tend to go badly for the party in power. Years with strong growth, like 1998 and 1978, tend to be non-events, or even net positives for the president’s party.

We don’t know what real disposable income will look like in 2022, especially because of the various coronavirus relief acts from 2020 and early this year. But for now, let’s assume growth is strong. This would also suggest modest Democratic losses, perhaps on the order of 6% of the caucus (or roughly 13 seats).
One other factor, though, is very important: the president’s job approval. Even in years with strong economic growth, like 1966, if the public is unhappy with the handling of a non-economic issue, his party will suffer. This is probably the strongest predictor we have seen:

The cases that fall off the line can largely be explained in terms of other issues we’ve witnessed: Democrats overperformed in 1978 because of the economy, and in 2014 because they had very little exposure. In 2010 and 1974 they underperformed because of the economy and, in the case of 2010, overexposure.
What we see from this is that the decline in President Bidens’ job approval from around 52% to 46% is consistent with a loss of an additional 5% of the Democrats’ caucus, or an additional 11 seats. If we put them altogether into a single regression analysis, we explain about two-thirds of the overall variation. This isn’t so bad, given the amount of randomness we have to explain here. The model suggests overall that the decline in Biden’s job approval will probably cost Democrats about eight seats.
Some of this is likely blowback to the botched withdrawal from Afghanistan, which may recede over the coming months. It may also be the case that there is some reluctance on the part of Democrats to respond to surveys right now, which artificially deflates his job approval.
Regardless, the decline in Biden’s job approval is consequential. Right now, he is probably sitting just below the “Mendoza line” that would represent a “normal” midterm, with perhaps no Senate losses and low double-digit House losses. If the president rebounds, Democrats will have a successful 2022, even if they narrowly lose the House. If he declines much further, however, it could turn into an ugly rout.
– – –